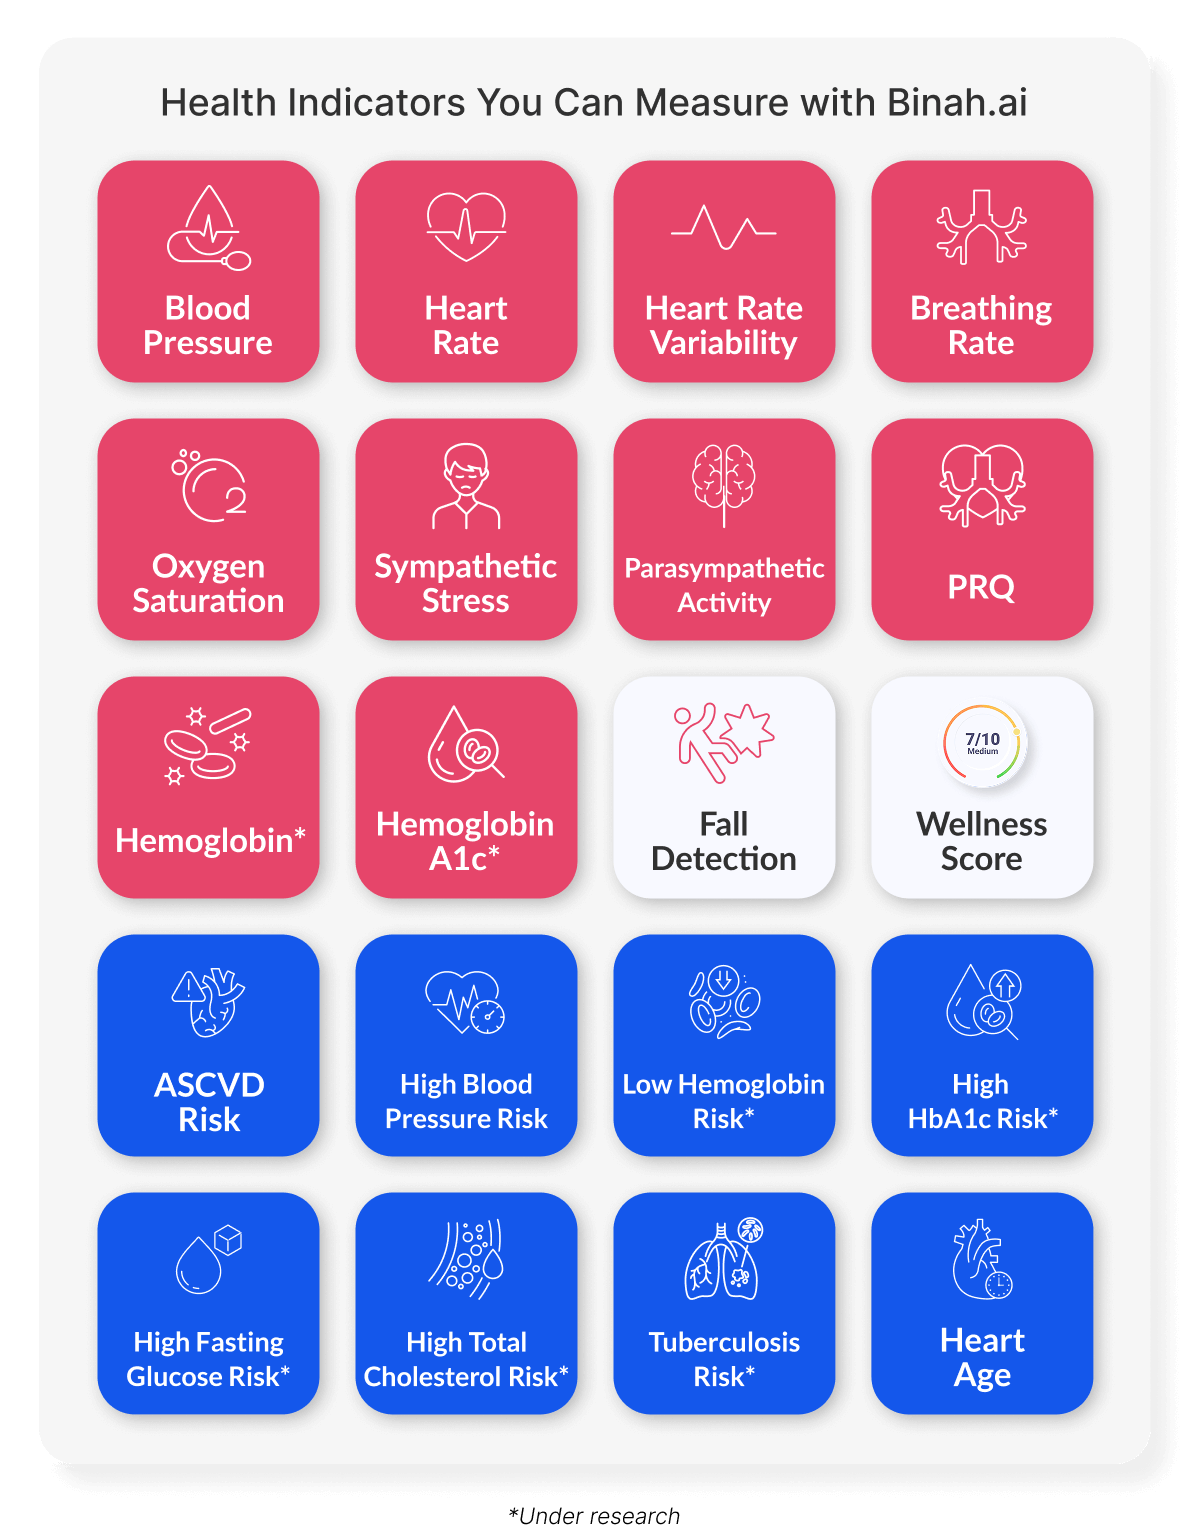
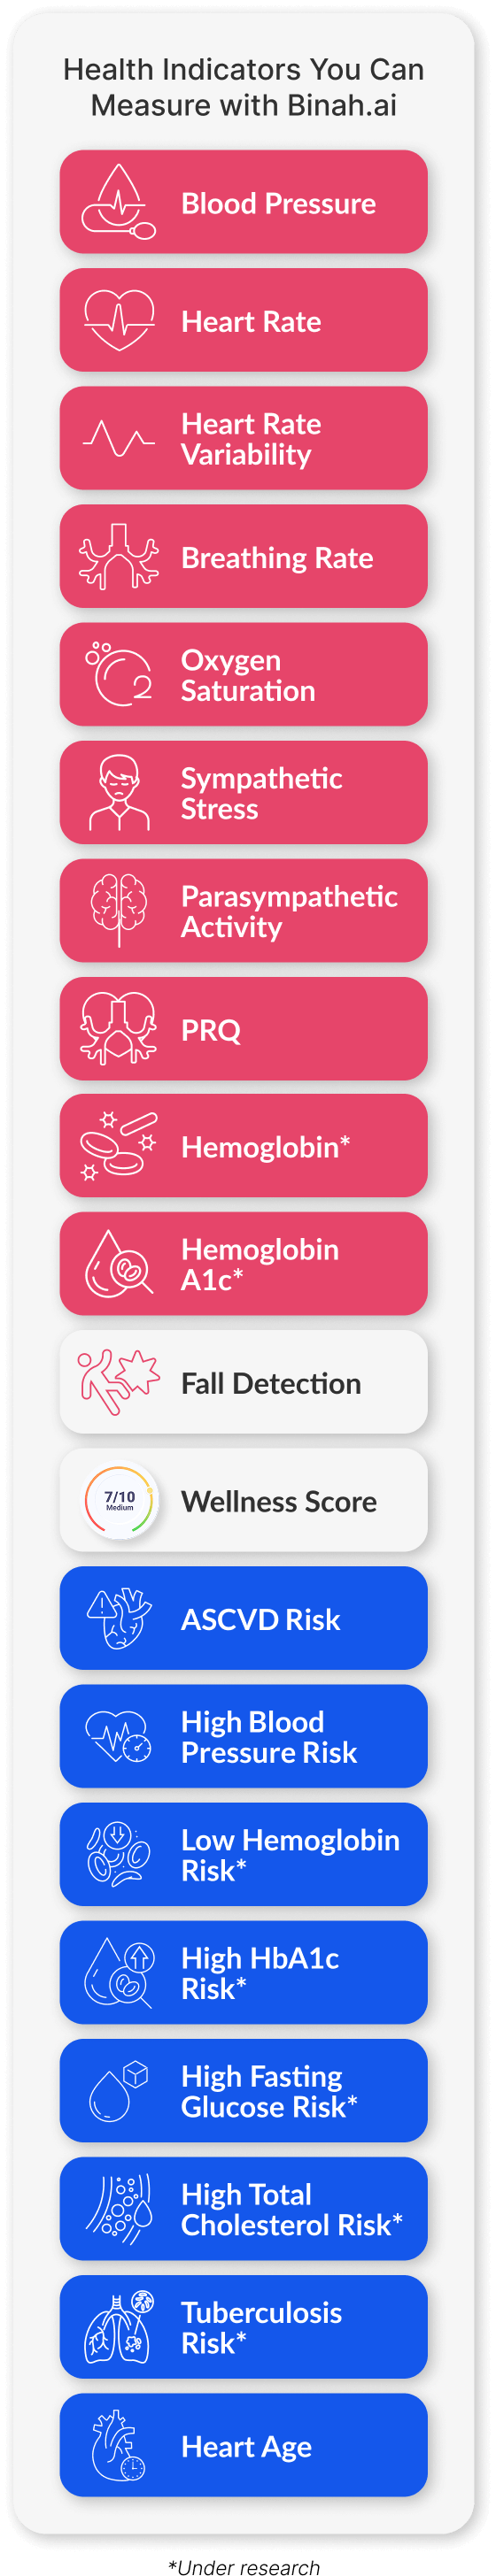
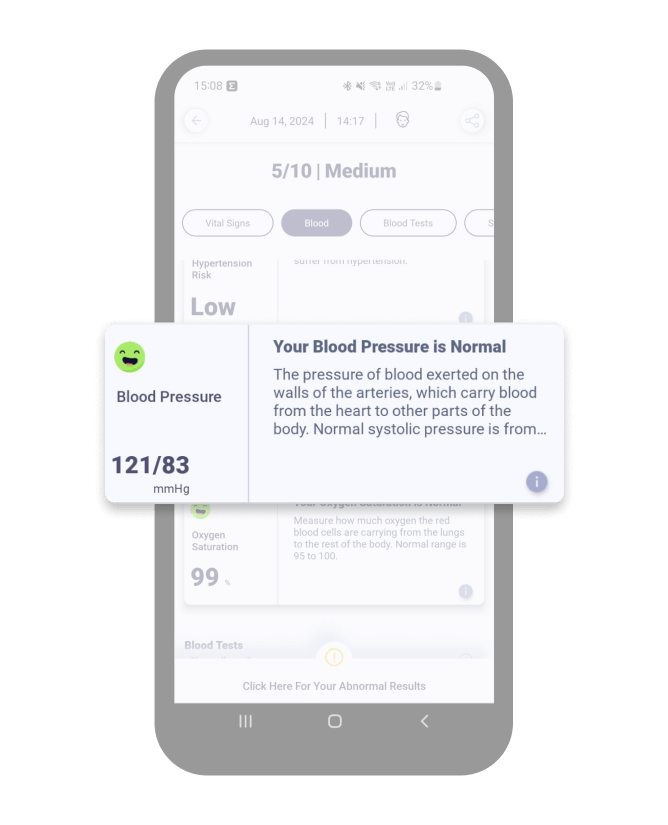
Blood pressure is a critical vital sign that measures the pressure of circulating blood against artery walls while an individual is at rest, and it is measured in two numbers. The first number, or systolic pressure, refers to the pressure inside the artery when the heart contracts and pumps blood throughout the body. The second number, or diastolic pressure, refers to the pressure inside the artery when the heart is at rest and is filling with blood.
Most people don’t know if they have high blood pressure – especially since there may be no noticeable warning signs or symptoms – and therefore the blood pressure must be monitored.
High blood pressure (hypertension), which is a major risk factor for health problems such as heart disease, heart attack, and stroke. In most cases, high blood pressure has no defined cause, and it is called primary hypertension. However, it is related to unhealthy lifestyles such as physical inactivity, stress, obesity, shift-work, pregnancy, etc. It should be emphasized that blood pressure can be managed through diagnosis, lifestyle changes, medication and long-term monitoring.
Blood pressure is categorized as low, normal, or elevated: Low blood pressure is a systolic of less than 100, normal blood pressure is a systolic of 100 to 129, while elevated blood pressure is systolic of 130 or higher.
To learn what conditions abnormal blood pressure levels are associated with, visit our wellness score page.
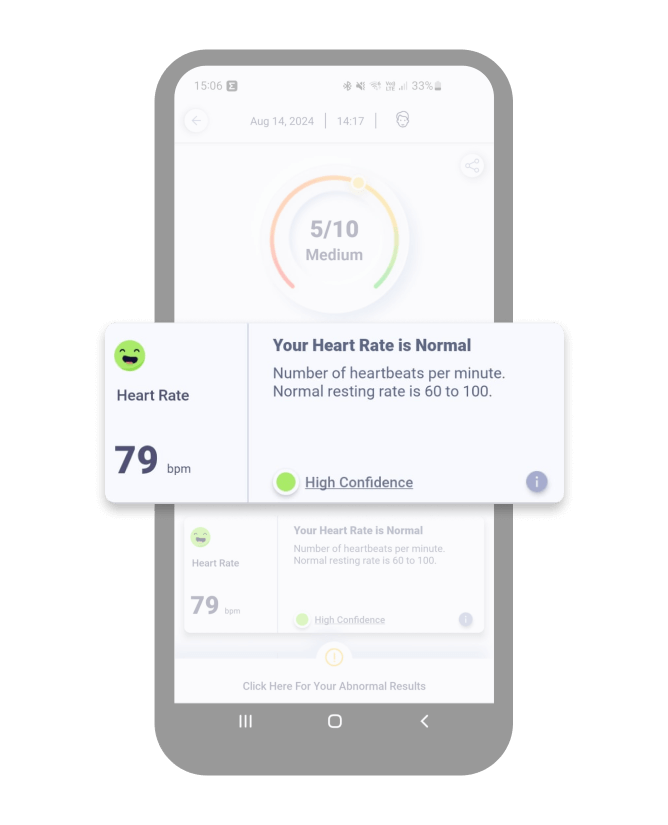
The heart rate vital sign measures the number of times the heart beats per minute. The normal resting heart rate for a healthy adult is between 60-100 bpm. Think of the heart as a pump that pushes blood throughout the body. With every beat, the heart pumps blood containing oxygen and nutrients around the body and brings back waste products. A healthy heart supplies the body with the right amount of blood at a rate proportionate to whatever activity the body is undertaking.
Normal resting rates can differ between people. Furthermore, heart rates are lower when at rest and increase during exercise and can be influenced by factors like, weather, body position, emotions, body size, medication, and use of caffeine and nicotine.
At rest, a fast heart rate may indicate acute health conditions such as an infection, dehydration, stress, anxiety, thyroid disorder, shock, anemia, or certain heart conditions. Moreover, it can predict a long term risk for cardiovascular events. A low heart rate is common for people who exercise frequently and participate in athletics.
Tracking heart rate can provide insight into fitness levels, heart health, and emotional health. For individuals taking medication for cardiovascular conditions, daily resting heart rate measurements can assist the doctor in advising on the proper course of treatment.
To learn what conditions abnormal heart rates are associated with, visit our wellness score page.
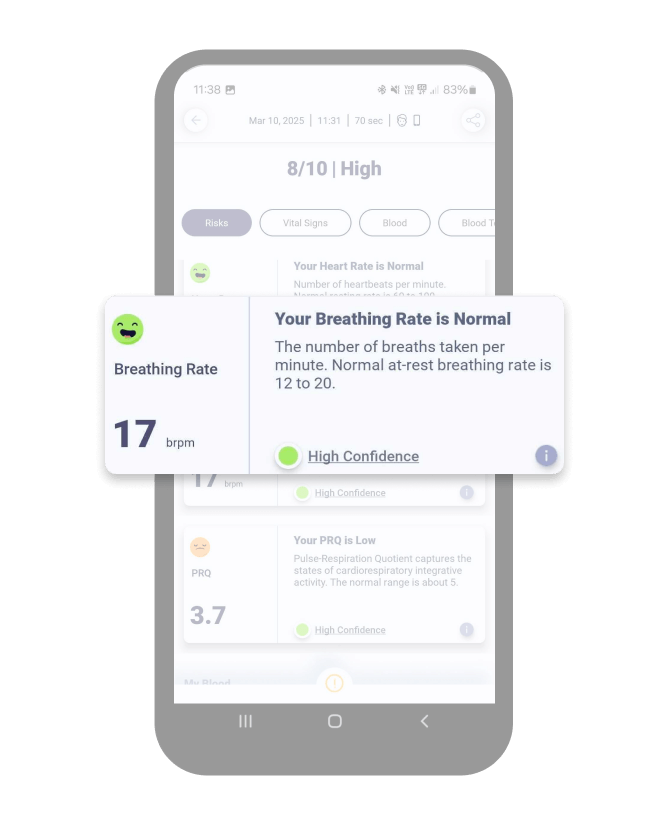
Breathing rate is a vital sign that measures the number of breaths taken per minute. The normal breathing rate for adults at rest ranges between 12-20 breaths per minute, but may reach up to 24 breaths per minute for some older individuals.
When inhaling, oxygen enters the lungs and circulates to the various internal organs. When exhaling, carbon dioxide moves out of the body. The breathing rate plays a critical role in keeping the balance of oxygen and carbon dioxide even in the body. If the carbon dioxide level in the blood is high and the oxygen level in the blood is low, breathing rate increases.
Various factors affect breathing rates, including injuries, exercise, fever, anxiety, emotions, mood, alcohol, medication, metabolic issues, and medical conditions. A high or low rate might be the result of an activity, and therefore does not indicate that there is anything wrong.
Monitoring the breathing rate vital sign can assist the doctor in providing medical advice. Furthermore, Athletes may use respiratory rate as an objective indicator of how hard they are working.
To learn what conditions abnormal breathing rates are associated with, visit our wellness score page.
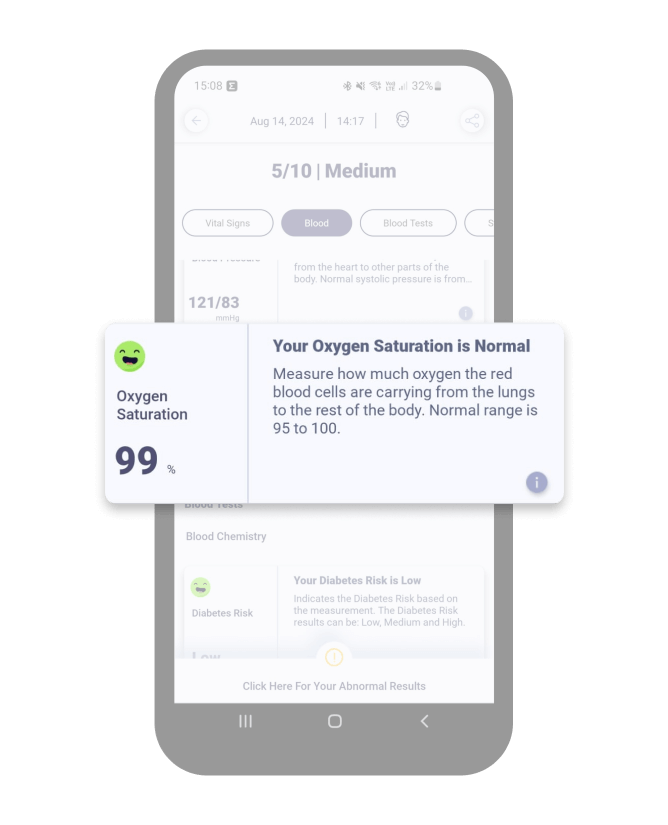
Oxygen saturation (SpO2) is another vital sign monitored to evaluate a person’s general health. Oxygen saturation is a measure of how much oxygen the red blood cells are carrying from the lungs to the rest of the body. Normal SpO2 for healthy lungs ranges between 95-100%. For individuals with chronic conditions or lung diseases, it could be lower than 95%.
A low level of oxygen in the blood is called hypoxemia. Typically, an oxygen saturation level lower than 90% is considered hypoxemia, which can be caused by chronic pulmonary diseases (COPD, COVID-19, Asthma, Lung Fibrosis, pulmonary hypertension), heart failure, sleep apnea, anemia, and high-altitude exposure (insufficient oxygen in the air) and medications that suppress breathing control. Common symptoms of hypoxemia include headache, rapid heart rate, coughing, shortness of breath, wheezing, confusion, and blueness of the skin and mucus membranes (cyanosis).
Oxygen saturation levels can also be used by athletes to understand whether a decrease in performance is a result of altitude changes or ability.
To learn what conditions abnormal SpO2 levels are associated with, visit our wellness score page.
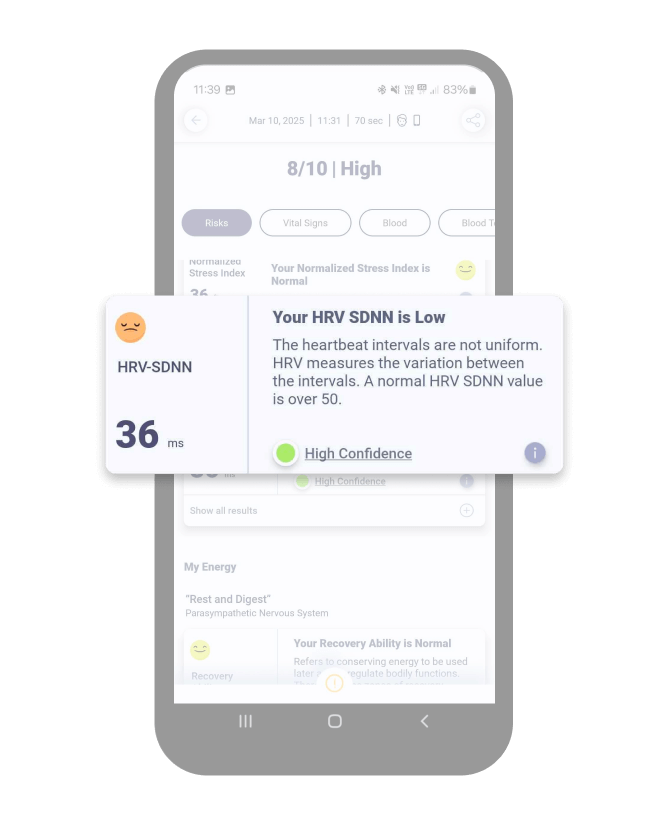
A healthy heart does not beat at regular intervals as would a metronome; rather, there are variations in time between beat to beat. These variations are measured by the Heart Rate Variability (HRV) metric and they reflect the functions of the parasympathetic and sympathetic nervous systems, the two components of the Autonomic Nervous System (ANS), which controls heart activity.
The sympathetic system is activated when the body is under stress, causing the heart to beat faster and more regularly, and causing HRV to decrease. The parasympathetic system manages the heart’s activity to help the body reach a relaxed state and to recover from a stressful event. This relaxation response results in a slower and less regular heartbeat and is indicated by a higher HRV.
High levels of HRV generally indicate aerobic and general fitness. Athletes may track HRV to adjust their training program. They can learn when the body is being overworked, which often results in a drop in HRV and to learn how fast they recover.
*Note: There are several ways to calculate HRV, including the one used by the Binah medical team, called SDNN. SDNN is the standard deviation of the intervals between each beat (also called NN intervals). Abnormal levels may indicate risk of stress, risk of cardiac events, oncoming sickness, nutrition and sleep patterns
To learn what conditions abnormal HRV levels are associated with, visit our wellness score page.
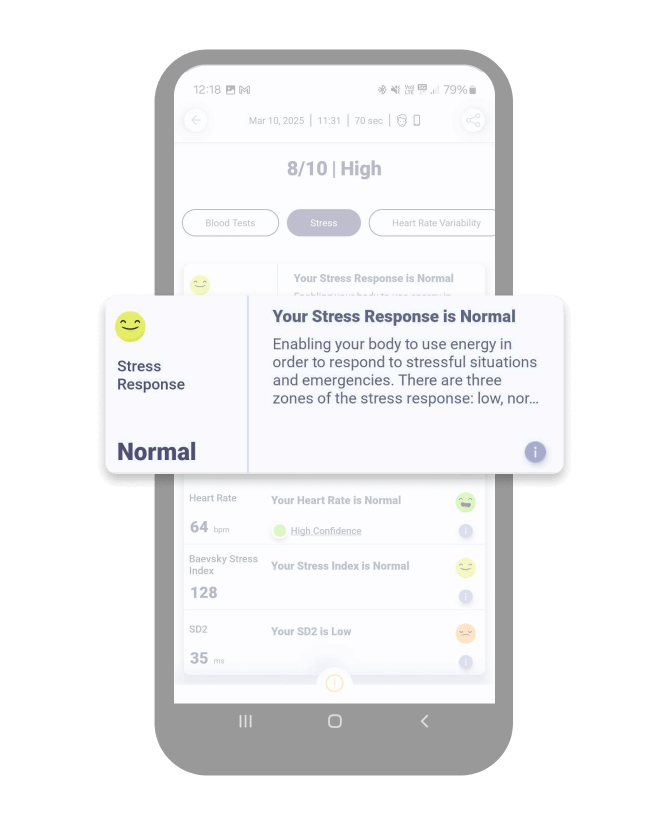
When you encounter a stressful situation, your body reacts by triggering a “fight or flight” response. Controlled by the sympathetic nervous system (SNS), this response includes several physiological changes that enhance your ability to respond to emergencies. These changes can include an increased heart rate, breathing rate, and blood pressure, as well as the redirection of blood flow from the skin and stomach to the brain, heart, and muscles. You might also have symptoms like sweating and goosebumps. While this stress response can be positive, keeping you alert, motivated, and ready to avoid danger, it can become a problem when stressors persist without relief or periods of relaxation.
Stress Response measures how effectively your body responds to stress. Stress Response is categorized into three zones: low, normal, and high. Low and normal zones indicate effective responses to stress, while a high score indicates that your body is not responding to stress effectively.
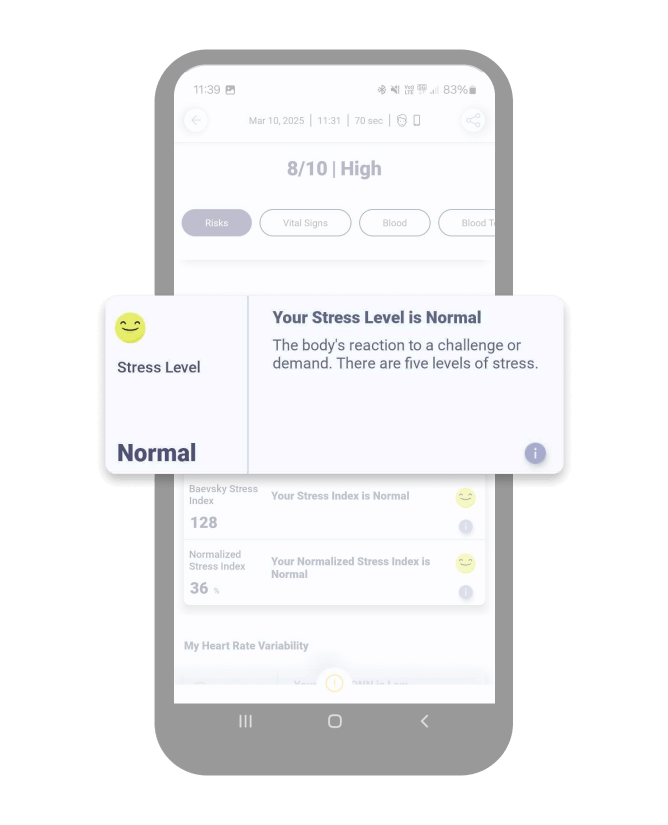
Binah.ai’s Stress Level metric uses heart rate variability (HRV) to quantify your stress level. A low score indicates a relaxed state, while a high score suggests a stressed state. These measurements are based on the internationally recognized Baevsky’s Stress Index.

The parasympathetic nervous system (PNS) regulates the body’s “rest and digest” response and plays an important role in alleviating stress and promoting recovery. It does so by inhibiting the activity of the sympathetic nervous system and the release of stress hormones, and returning bodily functions to their resting state by slowing the heart rate, lowering blood pressure, reducing muscle tension and restoring regular breathing, digestion and glandular activity.
The Recovery Ability indicator measures the activity of the PNS and indicates how capable a person is of relaxing or recovering after a stressful occurrence. A low score would indicate a stressful state, while a high score would suggest a relaxed one.
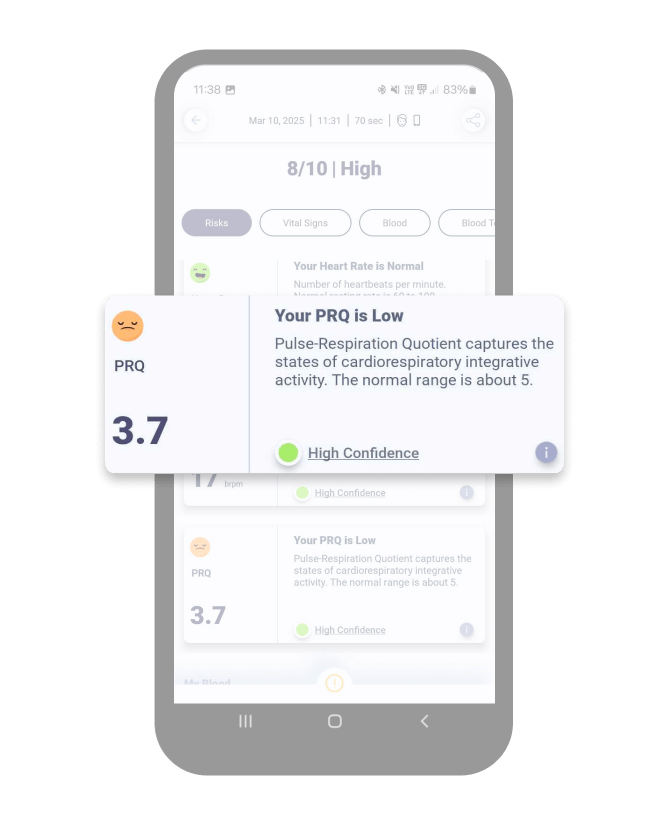
The pulse-respiration quotient (PRQ) reflects emergent properties of the complex interplay between cardiac and respiratory activities. The pulse-respiration quotient metric measures to what extent this interplay is functioning normally. A low or high score would indicate that your heart rate and/or breathing rate are disproportionate, which may indicate that both the heart and the lungs are working inefficiently.
To learn what conditions abnormal PRQ levels are associated with, visit our wellness score page.
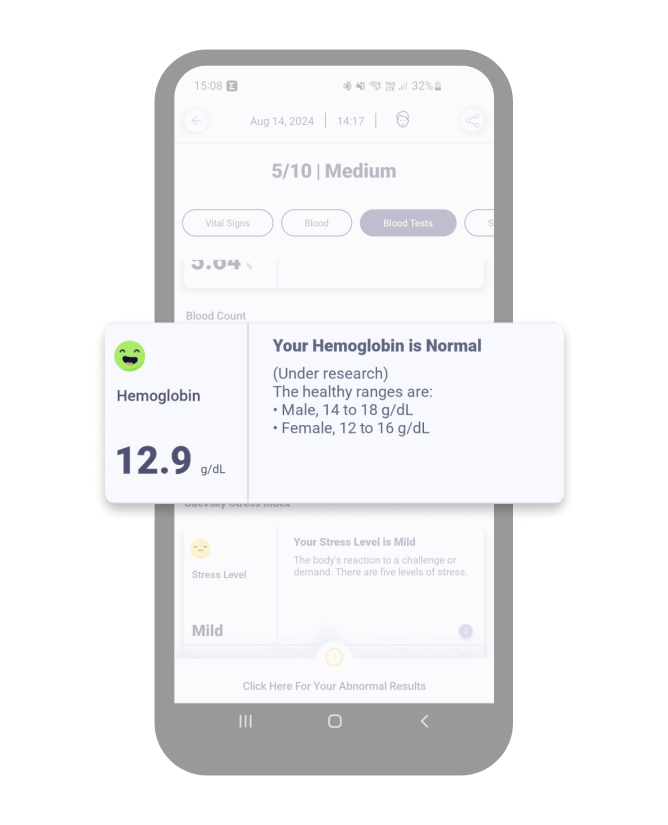
Hemoglobin* (*under research) is a protein in your red blood cells that carries oxygen to your body’s organs and tissues and transports carbon dioxide from your organs and tissues back to your lungs.
If a hemoglobin test reveals that your hemoglobin level is lower than normal, it means you have a low red blood cell count (anemia). Anemia can have many different causes, including vitamin deficiencies, bleeding and chronic diseases.
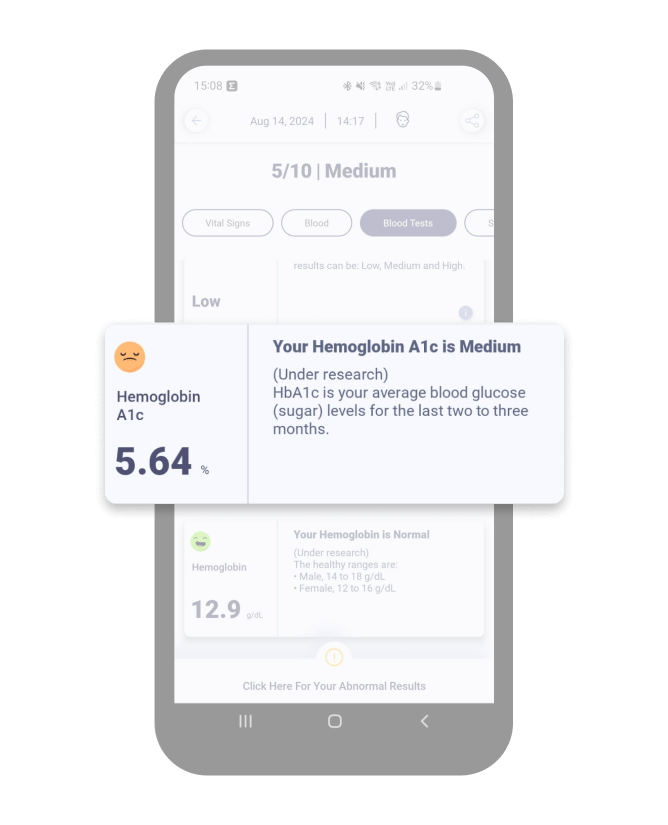
When sugar enters your bloodstream, it attaches to hemoglobin, a protein in your red blood cells. Everybody has some sugar attached to their hemoglobin, but people with higher blood sugar levels have more. The A1C test measures the percentage of your red blood cells that have sugar-coated hemoglobin. This test is generally used to test for diabetes. (*under research)
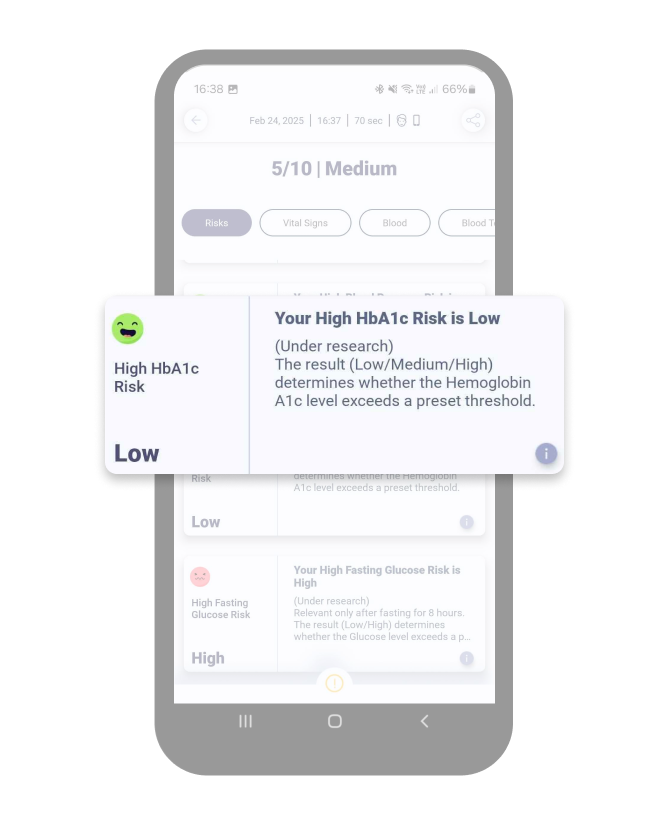
High HbA1c Risk*(*under research) assesses an individual’s risk of having elevated Hemoglobin A1c (HbA1c) levels. This indicator categorizes HbA1c risk into low, medium, or high, based on glycated hemoglobin measurements.
HbA1c reflects average blood sugar levels over the past two to three months, providing insight into long-term blood sugar control. Consistently high HbA1c levels may indicate difficulty in maintaining balanced glucose levels. Monitoring HbA1c is important because elevated levels can be an early sign of poor blood sugar management, potentially leading to metabolic health concerns. By tracking this indicator, individuals can gain awareness of their blood sugar stability and take proactive steps toward healthier lifestyle choices.
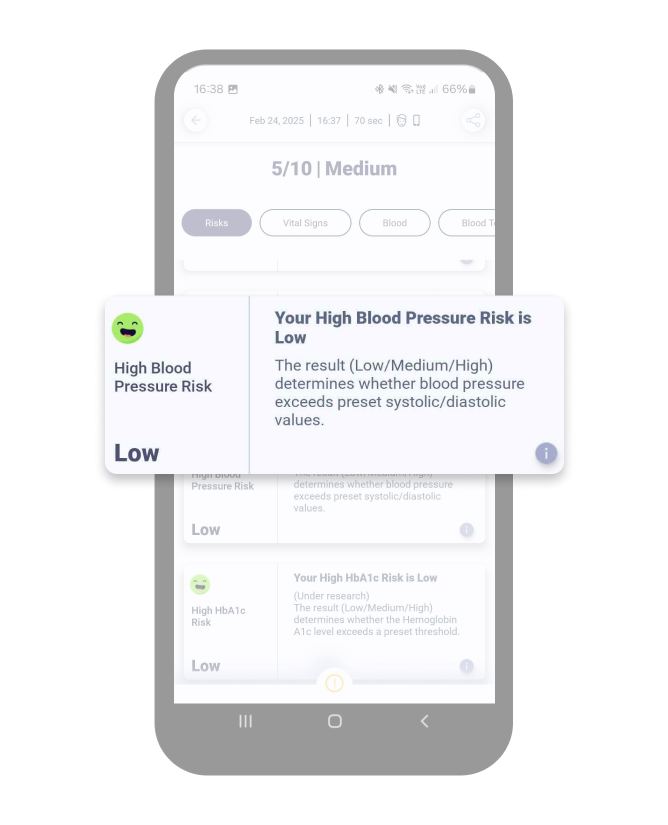
High Blood Pressure Risk assesses an individual’s risk of having elevated blood pressure levels. This indicator categorizes blood pressure risk into low, medium, or high, based on systolic and diastolic measurements.
Blood pressure is the force exerted by blood against artery walls. Consistently high blood pressure can strain the heart and blood vessels, increasing the risk of cardiovascular diseases. Since high blood pressure often has no noticeable symptoms, monitoring this indicator helps individuals take proactive steps, such as lifestyle adjustments or seeking professional guidance, to support cardiovascular health.
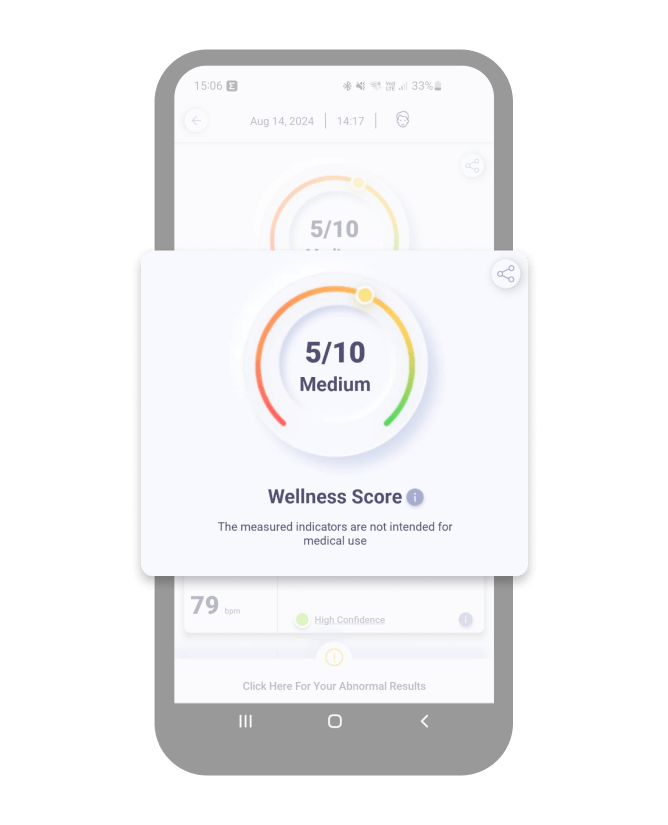
The Wellness Score is a predictive risk score that estimates a person’s cardiovascular risk for the next 5 to 10 years. Based on health indicators measured by Binah.ai’s technology, it serves as a reference when measured at rest under consistent conditions. Consistent scores over repeated measurements indicate reliable results.
How Is It Calculated?
The Wellness Score is measured on a scale from 1-10. A higher Wellness Score indicates a lower cardiovascular risk. The score considers various health indicators, including heart rate, HRV, blood pressure, and oxygen saturation. Because the score takes health risks seriously, the lowest value in the measurement will determine your score. So even if most of your measurements fall within the normal range, if, for example, an abnormal reading in any one indicator, such as blood pressure, will set your Wellness Score.
Many health indicators, like heart rate or HRV, can fluctuate due to physical activity, breathing, and emotional states. Therefore, it is crucial to measure your Wellness Score at rest and to do so on a consistent basis.
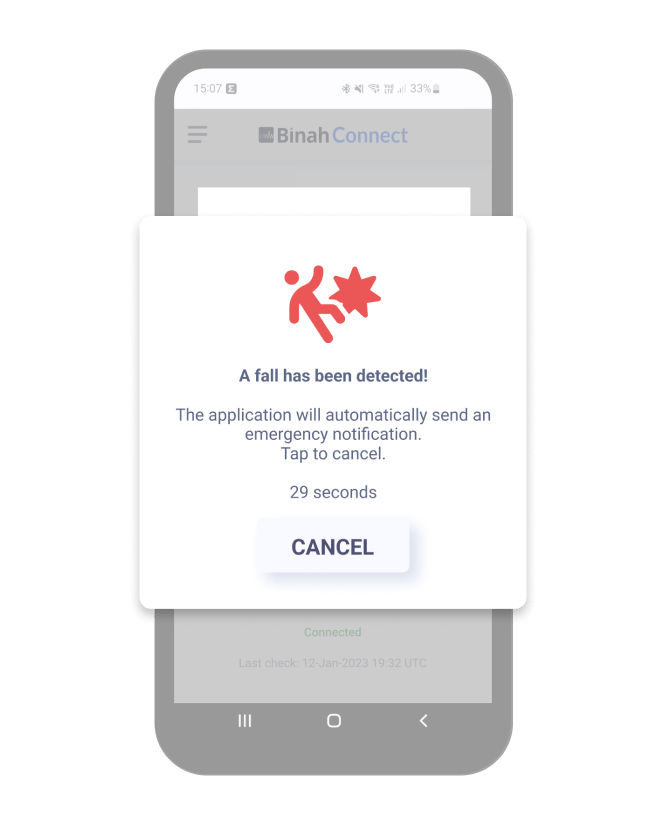
Fall detection helps put families, caretakers, employers, and stakeholders at ease by enabling them to receive real-time alerts so they can offer timely assistance in the event of a fall. As the second leading cause of accidental or unintentional injury deaths worldwide, falls are a significant health concern, particularly among older adults, individuals with certain medical conditions, and employees in high-risk environments. Every year, over 680,000 adults aged 60 and above lose their lives due to falls, while falls in the workplace cost approximately $70 billion annually in worker’s compensation and medical bills in the US alone. Fall detection can be crucial to improving outcomes, reducing healthcare costs, and enhancing employee safety.
Binah.ai’s fall detection feature uses signals received from the Polar Verity Sense™ optical heart rate sensor to detect falls. When a fall is detected, a timed alert is sent to the user’s phone. If unanswered, the system notifies the admin with the user’s location (if enabled) and triggers two vital sign checks to ensure the user’s wellbeing. These settings can be customized to suit your organization’s needs.
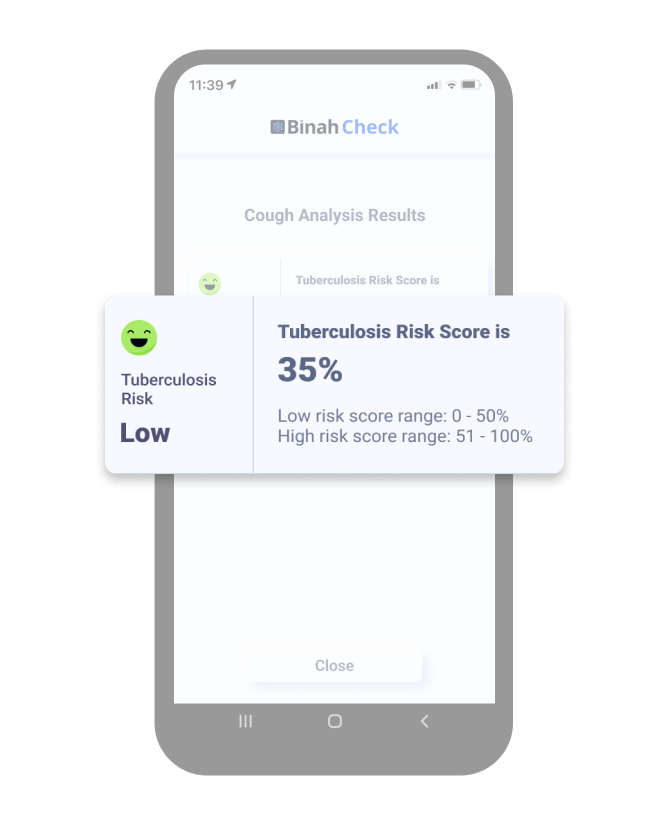
Binah.ai’s Tuberculosis (TB) Risk* (*under research) indicator assesses the likelihood that an individual is infected with tuberculosis, a bacterial infection primarily affecting the lungs. TB is spread through the air when an infected person coughs, sneezes, or talks. This indicator categorizes TB risk into low or high based on thousands of cough data points captured and analyzed by our technology.
Early detection and treatment of TB are crucial for preventing the spread of the disease and improving health outcomes. Symptoms of TB may include prolonged cough, chest pain, weight loss, and fatigue.
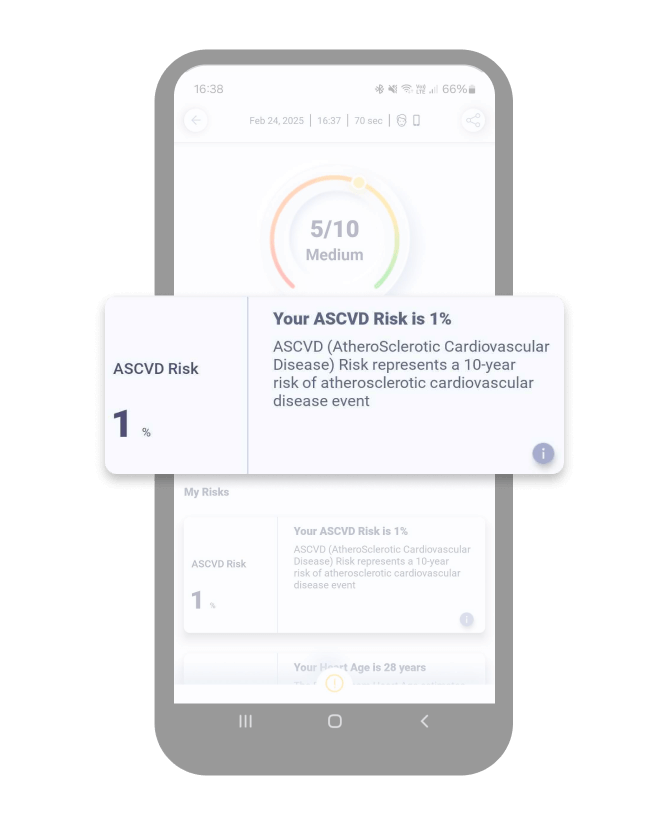
Atherosclerotic Cardiovascular Disease (ASCVD) risk is a measure used to estimate an individual’s likelihood of developing cardiovascular diseases, such as heart attack and stroke, over the next 10 years. This risk is calculated using factors like age, gender, blood pressure, smoking status, diabetes, and other health conditions. ASCVD risk assessment aids in early detection and personalized management, ultimately reducing the risk of cardiovascular events.
Binah.ai’s assessment utilizes the internationally recognized Framingham risk score and is based on public domain databases that help identify high-risk individuals who may benefit from preventive measures, including lifestyle modifications and medication.
ASCVD risk is categorized into low, moderate, or high:
High ASCVD risk is often associated with conditions such as high blood pressure, high cholesterol, obesity, diabetes, and smoking. Regular monitoring and consultation with healthcare providers can help individuals take appropriate lifestyle changes and medical interventions to manage and mitigate ASCVD risk.
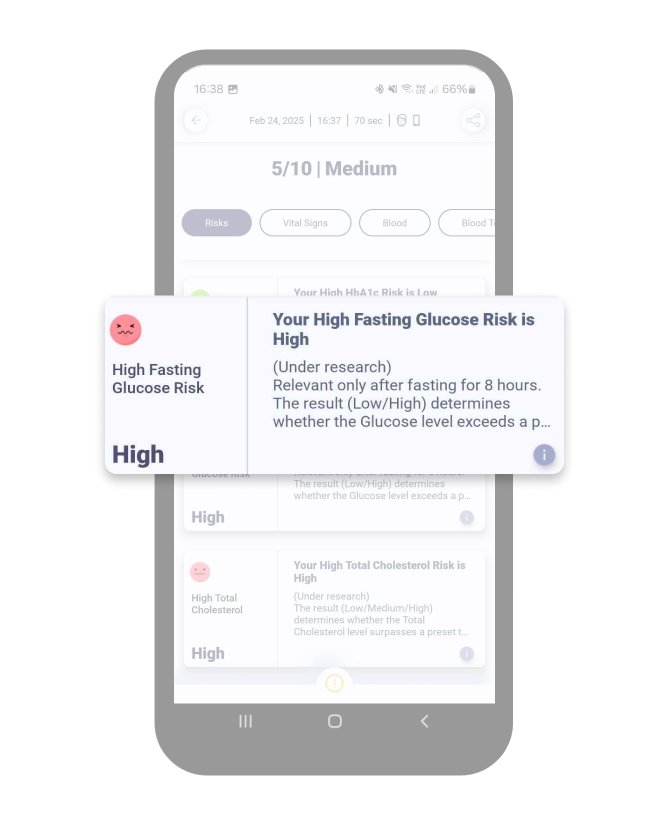
High Fasting Glucose Risk* (*under research) assesses an individual’s risk of having elevated fasting blood glucose levels. This indicator categorizes fasting glucose risk into low or high, based on glucose levels measured after 8-12 hours of fasting.
Glucose is the body’s primary source of energy. High fasting glucose levels indicate poor blood sugar control, which may be an early sign of prediabetes or diabetes mellitus. Since elevated glucose levels may not always cause immediate symptoms, monitoring this indicator helps individuals stay aware of their blood sugar control and take steps toward healthier lifestyle choices.
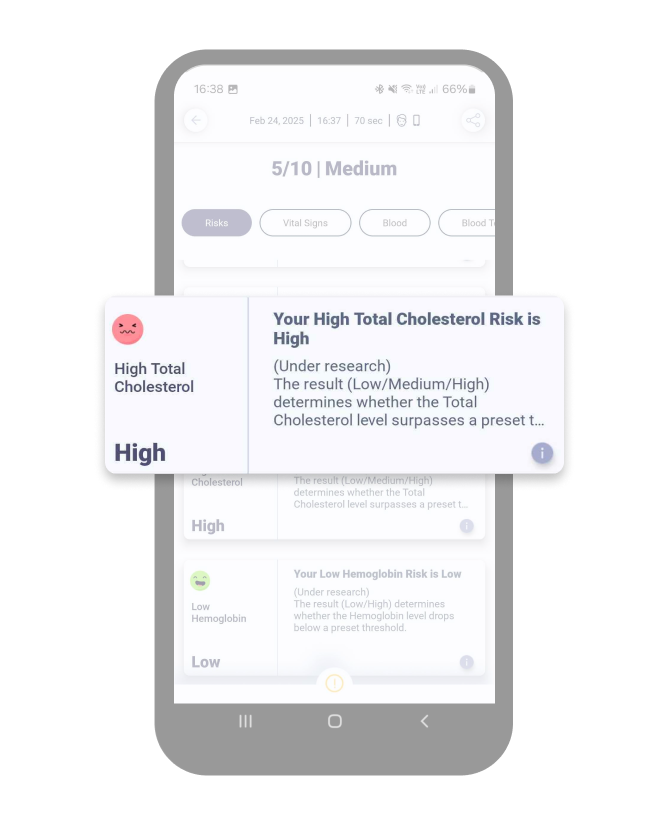
High Total Cholesterol Risk* (*under research) assesses an individual’s risk of having elevated cholesterol levels. This indicator categorizes cholesterol risk into low, medium, or high, based on total cholesterol measurements.
Cholesterol is a lipid (fat-like substance) found in the blood, essential for cell function and hormone production. However, excessive cholesterol levels can contribute to the buildup of fatty deposits in blood vessels, leading to atherosclerosis. This condition narrows and hardens the arteries, increasing the risk of cardiovascular diseases. Monitoring this indicator allows individuals to take proactive steps, such as lifestyle adjustments, to maintain balanced cholesterol levels and support heart health.
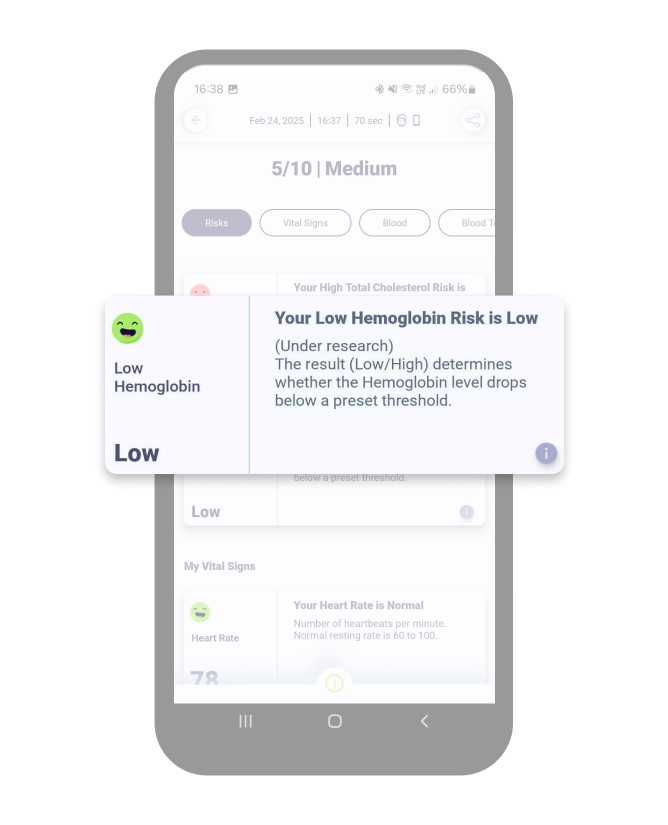
Low Hemoglobin Risk* (*under research) assesses the risk of an individual having hemoglobin levels below the normal range. This indicator categorizes hemoglobin risk into low or high, based on hemoglobin concentration in the blood.
Hemoglobin is a protein in red blood cells responsible for transporting oxygen throughout the body. Low hemoglobin levels reduce the body’s oxygen-carrying capacity, which may lead to fatigue, dizziness, and shortness of breath. Monitoring this indicator helps individuals become aware of potential hemoglobin deficiencies and take necessary steps to support their overall health and wellbeing.
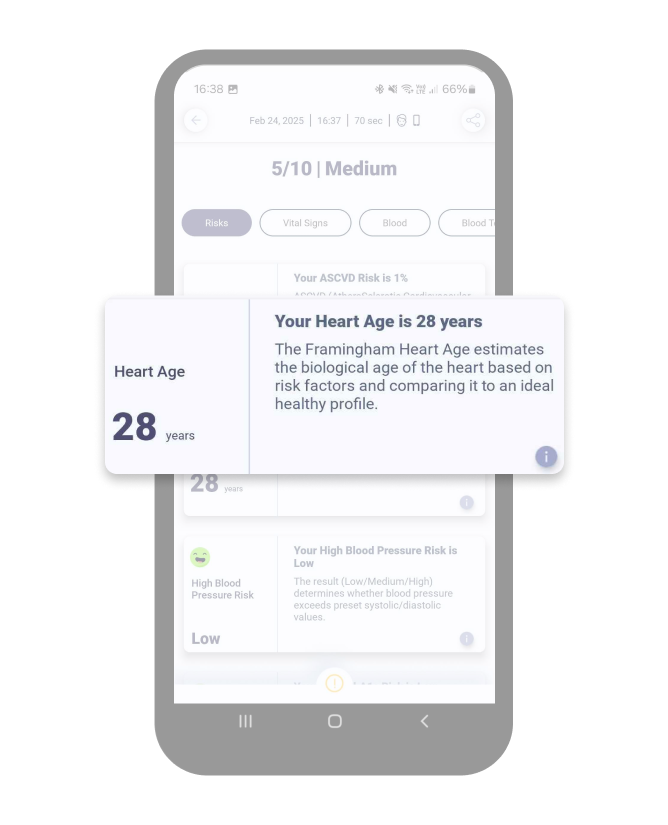
Heart Age estimates the biological age of the heart by evaluating cardiovascular risk factors and comparing them to an ideal healthy profile.
Based on the Framingham Heart Study, the Heart Age compares an individual’s heart health to that of an average, healthy person of the same sex, using optimal risk factor values (e.g., healthy cholesterol, no smoking, normal blood pressure). The Heart Age is the chronological age of this “ideal” individual with the same risk level.
A Heart Age that is equal to or below chronological age indicates normal or better-than-average cardiovascular health. A Heart age that is older than chronological age suggests higher cardiovascular risk and potential need for lifestyle changes or medical intervention.
Get better insight into client wellness and risk levels with Binah.ai’s health and wellness monitoring technology. Boost your services with Binah SDK today.